Definitions used throughout the different PBI boards.
Table of Contents
Dashboard MRR - customer specific
Freemium & Converted Running Total
ARPA - Average Revenue Per Account
Manipulated PLG table with freemium
Dashboard MRR page
MRR Cumulative
The cumulative Monthly Recurring Revenue (MRR) is calculated as the sum of all changes in MRR, and the cumulative total of change shows given total MRR at any point in time. This visual is based on the creation date of the event, where each event is either a positive or negative change in MRR.
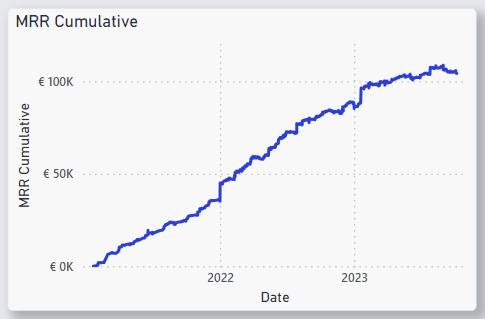
x-axis: mrr_changes[creation_date]
y-axis: mrr_changes[MRR cumulative]
DAX Code:
MRR Cumulative =

CALCULATE (

   SUMX (

      'mrr_changes',

      'mrr_changes'[added_mrr]

   ),

   FILTER (

      ALL ( 'mrr_changes' ),

      'mrr_changes'[created_at] <= MAX ('mrr_changes'[created_at])

   )

)
MRR Change
Breakdown of the events of change in MRR using the table mrr_changes_modified to calculate the Event types. The events for each customer are defined as following:
- New: there is no previous value of MRR and the current value is larger than 0.
- Churn: the previous MRR is larger than 0 and the current value is 0.
- Downgrade: the previous is larger than the current value, and the current value is larger than 0.
- Upgrade: the current is larger than the previous value, and the previous value is larger than 0.
- Reactivation: the previous value is 0, and the current value is larger than 0.
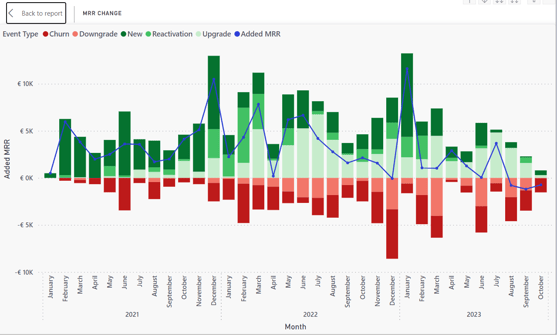
X-axis: mrr_changes_modified[created_at]
Y-axis: mrr_changes_modified[added_mrr]
Line y-axis: mrr_changes_modified[added_mrr]
Column legend: mrr_changes_modified[event_type]
DAX code:
event_type =

VAR PreviousValue = 'mrr_changes_modified'[mmr_previous]

VAR CurrentValue = 'mrr_changes_modified'[mmr_current]

RETURN

    IF(ISBLANK(PreviousValue) && CurrentValue > 0,

        "New",

        IF(PreviousValue > 0 && CurrentValue = 0,

            "Churn",

            IF(PreviousValue > CurrentValue && CurrentValue > 0,

                "Downgrade",

                IF(PreviousValue < CurrentValue && PreviousValue > 0,

                    "Upgrade",

                    IF(PreviousValue = 0 && CurrentValue > 0,

                        "Reactivation",

                        BLANK()

                    )

                )

            )

        )

    )
Current MRR - Monthly Recurring Revenue
Current MRR is the last value of cumulative sum of MRR changes.

Value: mrr_changes_modified[MRR Cumulative]
Trend axis: mrr_changes_modified[created_at]
Current ARR
The current ARR is calculated by multiplying the current MRR by 12.
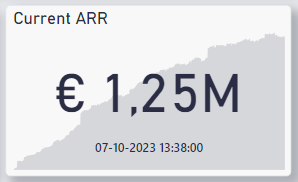
Value: mrr_changes_modified[ARR Cumulative]
Trend axis: mrr_changes_modified[created_at]
DAX code:
ARR_cumulative = 12 * [MRR Cumulative]
Projected Churn
This graph was possible to make with an earlier version of the MRR table, but in general there were too many problems with that version.
Projected churn might be possible to calculate with the churn-table (which currently is not syncing correctly).
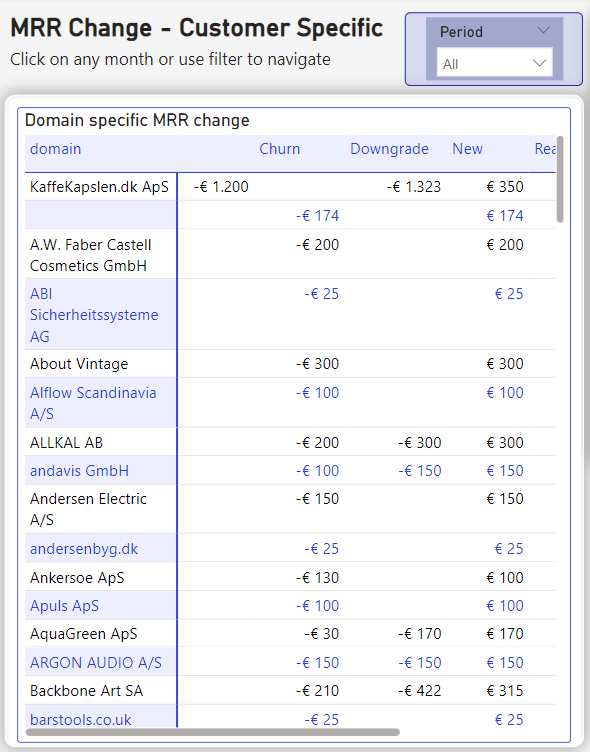
Dashboard: MRR Change - Customer Specific
The second MRR page contains two of the same graphs as in the first MRR table, and is meant to give insight of which customers is causing the change in MRR in a given month. The interactive filtering of the page allows the user to choose a month by clicking the desired month in either the MRR change visual or the MRR Cumulative visual. The user can also select longer periods with the Period filter. Selecting a month or period will filter the Domain Specific MRR Change matrix, which lists each customer that has provided a change to the MRR in the given period.
Dashboard - PLG page
Freemium Conversion Rate
The Freemium Conversion Rate visual shows the total signups (meaning freemiums) for each month, and how many of those signups has converted into either a scaleup or a startup subscription. The conversion rate is the percentage of converted subscriptions each month. Because of some limitations in Power BI, this visual consists of two separate bar charts stacked on top of each other - in order to have the total signups only represented by a number and the converted as the stacked columns.
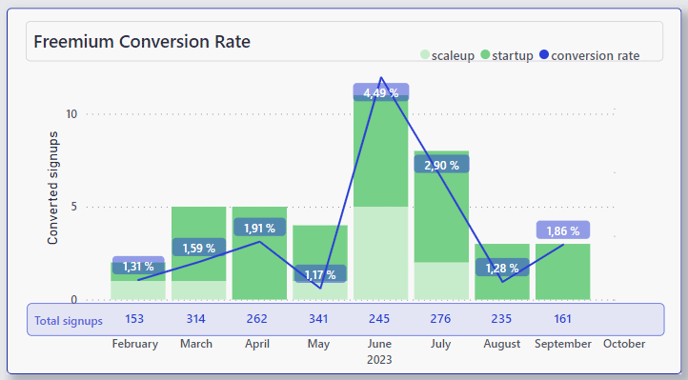
Total converted
The Total Converted-measure is simply all the subscriptions that has converted to either scaleup or startup.
DAX Code:
total converted = [scaleups] + [startups]
startups = COUNTROWS(

    FILTER('plg_including_freemium',

    'plg_including_freemium'[Tier]="startup")

)
Scaleups
A measure that only counts the scaleup conversions in the table plg_including_freemium.
DAX Code:
scaleups = COUNTROWS(

    FILTER('plg_including_freemium',

    'plg_including_freemium'[Tier] = "scaleup")

)
Total signups
A count of the rows in the table plg_inlcuding_freemium.
DAX Code:
total signups = COUNTROWS('plg_including_freemium')
Needs to be revised after new iteration.
Conversion rate
The conversion rate in the visual Freemium Conversion Rate is simply dividing the total converted by the total signups
conversion rate = DIVIDE([total converted],[total signups],0)
Freemium & Converted Running Total
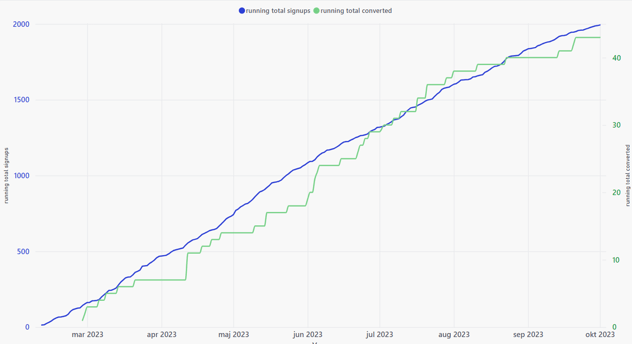
running total converted =

CALCULATE (

   SUMX (

      'plg_including_freemium',

      'plg_including_freemium'[total converted]

   ),

   FILTER (

      ALL ( 'plg_including_freemium' ),

      'plg_including_freemium'[created_at] <= MAX ('plg_including_freemium'[created_at])

   )

)
running total signups =

CALCULATE (

   SUMX (

      'plg_including_freemium',

      'plg_including_freemium'[total signups]

   ),

   FILTER (

      ALL ( 'plg_including_freemium' ),

      'plg_including_freemium'[created_at] <= MAX ('plg_including_freemium'[created_at])

   )

)
Active customers - visual
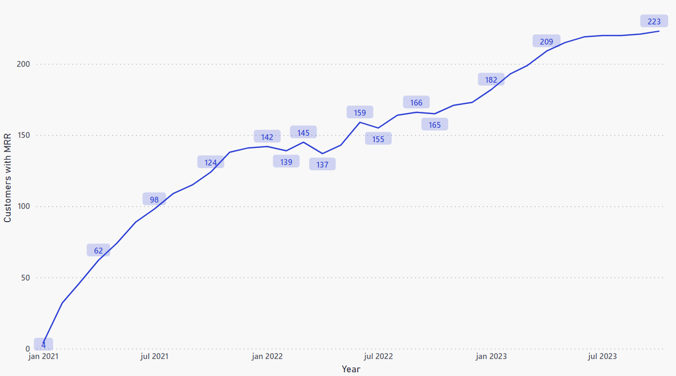
- GRAPHCumulative Customer Change definition:
GRAPHCumulative Customer Change =

CALCULATE (

   SUMX (

      'mrr_changes_modified',

      'mrr_changes_modified'[CustomerCountChange]

   ),

   FILTER (

      ALL ( 'mrr_changes_modified' ),

      'mrr_changes_modified'[created_at] <= MAX ('mrr_changes_modified'[created_at])

   )

)
- CustomerCountChange definition
This measure counts every event type in the mrr table as either +1 for the events "New" and "Reactivation" and -1 for "Churn".
DAX Code:
CustomerCountChange =

IF('mrr_changes_modified'[event_type] = "New" || 'mrr_changes_modified'[event_type] = "Reactivation", 1,

    IF('mrr_changes_modified'[event_type] = "Churn", -1, 0))
Numbers in Selected Period
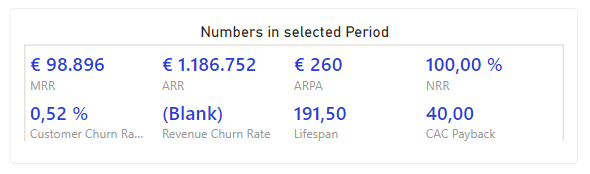
ARPA - Average Revenue Per Account
The ARPA measure is based on the formula:
ARPA = MRR / Active Customers
To make this measure adjustable to filter over time it is created with two other measures: The MRR at the period end and the number of active customers at the period end.
DAX Code:
ARPAperiod = CALCULATE(DIVIDE([MRR_period_end], [ActiveCustsEndPeriod]))
- MRR_period_end definition:
The MRR at the end of the chosen period - meaning the last cumulative total of chosen period. If the period is one month or one year, this will be the same number if it ends on the same date.
DAX Code:
MRR_period_end =

VAR _rangeEnd = LASTDATE(DATETABLE[Date])

RETURN

CALCULATE (

   SUMX (

      'mrr_changes',

      'mrr_changes'[added_mrr]

   ),

   FILTER (

      ALL ( 'mrr_changes' ),

      'mrr_changes'[created_at] <= _rangeEnd)

)
- ActiveCustsEndPeriod definition:
Counts every unique customer that also appears in the mrr table - that has more than one [ActiveSubsEndOfPeriod], assuring that the only customers counted are the ones that has or have had an mrr.
DAX Code:
ActiveCustsEndPeriod =

CALCULATE(

    COUNTROWS(SUMMARIZE(

        FILTER(subscriptions, subscriptions[customer_id] IN VALUES('mrr_changes'[customer_id])),

        subscriptions[customer_id]

    )),

    FILTER(

        subscriptions,

        [ActiveSubsEndOfPeriod] > 0

    )

)
- ActiveSubsEndOfPeriod definition:
This measure simply counts every subscription that are created before the end date of the period and deducts every subscription that has churned before the end date.
DAX Code:
ActiveSubsEndOfPeriod =

VAR _rangeEnd = LASTDATE('DATETABLE'[Date])

VAR _subs = CALCULATE(

    DISTINCTCOUNT(subscriptions[id]),

    subscriptions[created_at] <= _rangeEnd

)

VAR _churn = CALCULATE(

    DISTINCTCOUNT(subscriptions[id]),

    'subscriptions_churned'[churn_date] <= _rangeEnd

)

VAR _paused = CALCULATE(

    DISTINCTCOUNT(subscriptions[id]),

    subscriptions[created_at] <= _rangeEnd,

    subscriptions[status] = "paused"

)

RETURN _subs - _churn - _paused
NRR (November) =
(mrr_changes_modified[MRR_period_start] + mrr_changes_modified[MRR_period_change_without_new])
 / mrr_changes_modified[MRR_period_start]
MRR_period_change_excluding_new
This is every event in the mrr table excluding New, for a chosen time period.
DAX Code:
MRR_period_change_without_new (November) =

VAR _rangeStart = FIRSTDATE(DATETABLE[Date])

VAR _rangeEnd = LASTDATE(DATETABLE[Date])

RETURN CALCULATE (

   SUMX (

      FILTER('mrr_changes_modified', 'mrr_changes_modified'[event_type] <> "new"),

      'mrr_changes_modified'[added_mrr]

   ),

   FILTER (

      ALL ( 'mrr_changes_modified' ),

      'mrr_changes_modified'[created_at] <= _rangeEnd && 'mrr_changes_modified'[created_at] >= _rangeStart

   )

)
YESChurn Rate = DIVIDE(([ActiveCustsStartPeriod]+[NewCustomersInPeriod]-[ActiveCustsEndPeriod]),[ActiveCustsStartPeriod])
- ActiveCustsStartPeriod definition:
ActiveCustsStartPeriod =

CALCULATE(

    COUNTROWS(SUMMARIZE(

        FILTER(subscriptions, subscriptions[customer_id] IN VALUES('mrr_changes'[customer_id])),

        subscriptions[customer_id]

    )),

    FILTER(

        subscriptions,

        [ActiveSubsStartOfPeriod] > 0

    )

)
- NewCustomersInPeriod definition:
NewCustomersInPeriod =

VAR _periodStart = FIRSTDATE(DATETABLE[Date])

VAR _periodEnd = LASTDATE(DATETABLE[Date])

RETURN

COUNTROWS(

    FILTER(

        SUMMARIZE(

            subscriptions,

            subscriptions[customer_id],

            subscriptions[created_at]

        ),

        CALCULATE(

            COUNTROWS(subscriptions),

            subscriptions[customer_id] = EARLIER(subscriptions[customer_id]) &&

            subscriptions[created_at] < _periodStart

        ) = 0 &&

        subscriptions[created_at] >= _periodStart && subscriptions[created_at] <= _periodEnd &&

        subscriptions[customer_id] IN VALUES('mrr_changes'[customer_id])

    )

)
Revenue Churn Rate
The revenue churn rate is calculated with the formula
MRR churn in period / MRR at period start
DAX Code:
Revenue Churn Rate = (mrr_temporary_table[MRR_churn_period] / mrr_changes[MRR_period_start])
- MRR_churn_period definition:
MRR_churn_period =

VAR _rangeStart = FIRSTDATE(DATETABLE[Date])

VAR _rangeEnd = LASTDATE(DATETABLE[Date])

RETURN

CALCULATE (

   SUMX (

      'mrr_temporary_table',

      'mrr_temporary_table'[added_mrr]

   ),

   FILTER (

      ALL ( 'mrr_temporary_table' ),

      'mrr_temporary_table'[created_at] <= _rangeEnd &&

      'mrr_temporary_table'[created_at] >= _rangeStart &&

      ('mrr_temporary_table'[event_type] = "Downgrade" || 'mrr_temporary_table'[event_type] = "Churn")

   )

)
- MRR_period_start definition:
MRR_period_start =

VAR _rangeStart = FIRSTDATE(DATETABLE[Date])

RETURN

CALCULATE (

   SUMX (

      'mrr_changes',

      'mrr_changes'[added_mrr]

   ),

   FILTER (

      ALL ( 'mrr_changes' ),

      'mrr_changes'[created_at] <= _rangeStart)

)
Lifespan
The lifespan is
and is calculated by dividing 1 with the customer churn rate:
Lifespan = 1 / Customer Churn Rate
Th DAX code is as following:
Lifespan = 1 / [YESChurn Rate]
CAC Paycback
The CAC Payback is calculated with the formula:
CAC / (ARPA - CAC per customer)
DAX Code:
CAC Payback = [CAC (Monthly)] / ([ARPAperiod] - ([CAC (Monthly)]/[ActiveCustsEndPeriod]))
The Monthly CAC is a fixed number right now - need data on this.
Dashboard: Human AI Translation
Scores below threshold
This donut chart visualizes all segments that contains domains below threshold. This visualization also allows for filtering of the Segments table in the same dashboard. The DAX code for each dimension is provided below.
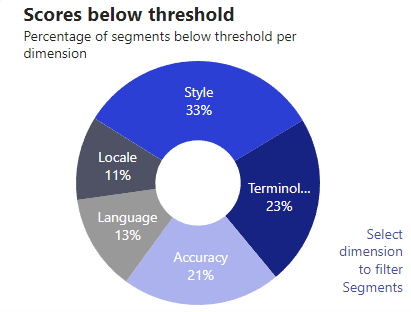
Thresholds: In general the threshold value is referred to the adjustable average score across the five dimension scores.
The visual Scores below Threshold illustrates the dimension scores that is below the given threshold - regardless if the segment as a whole has been flagged for human intervention.
For each dimension, a calculated column has been created, that classifies the dimension-scores as below (TRUE) or above (FALSE) threshold. This binary classification enables the visualization of the sum of each dimension below threshold.
tr_accuracy = IF('human_ai_data'[qa_score_accuracy] < [Threshold], TRUE, FALSE)
The threshold value is simply manually set for now:
Threshold = 90
Word count Human vs AI
The donut chart represents the total amount of words that are flagged for human translation (the sum of words where the segment's average score is below threshold). The ai portion of this visual represents the sum of words in the segments where the average score is above the threshold, and thus not being flagged.
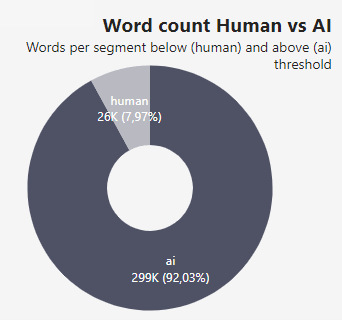
Currently, both donut charts in Power BI use a manually set threshold value of 90, due to the absence of up-to-date threshold data. This value is chosen as the default setting.
Segments
This table displays the source and target for each segment, their different dimension scores, the creation date, comment and source and target language
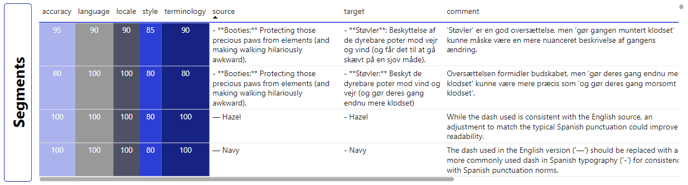
A customized filter is applied to the Segments table, to enable the filtering of dimension scores below threshold. This filter uses the calculated columns that provides binary classifications of the scores, showing each selected domain from the Scores below Threshold visual.
FilteredDataCount =

VAR SelectedDomain = SELECTEDVALUE(dimension_scores_below_threshold[Domain], "All")

RETURN

    IF(

        SelectedDomain = "All",

        CALCULATE(

            COUNTROWS('human_ai_data'),

            'human_ai_data'[tr_accuracy] = TRUE() ||

            'human_ai_data'[tr_language] = TRUE() ||

            'human_ai_data'[tr_locale] = TRUE() ||

            'human_ai_data'[tr_style] = TRUE() ||

            'human_ai_data'[tr_term] = TRUE()

        ),

        SWITCH(

            SelectedDomain,

            "Accuracy", CALCULATE(COUNTROWS('human_ai_data'), 'human_ai_data'[tr_accuracy] = TRUE),

            "Language", CALCULATE(COUNTROWS('human_ai_data'), 'human_ai_data'[tr_language] = TRUE),

            "Locale", CALCULATE(COUNTROWS('human_ai_data'), 'human_ai_data'[tr_locale] = TRUE),

            "Style", CALCULATE(COUNTROWS('human_ai_data'), 'human_ai_data'[tr_style] = TRUE),

            "Terminology", CALCULATE(COUNTROWS('human_ai_data'), 'human_ai_data'[tr_term] = TRUE),

            BLANK()

        )

    )
Segments and Word Count filters
This box contains all filters on the page, that affects the Word count Human vs. AI visual and the Segments visual. This

Tables
Subscriptions table
The subscriptions table is extracted from Stripe and contains information about each unique subscription, with the following columns.
|
id |
Unique subscription-id from Stripe in format: (PK) sub_1KQHuluxrqX8Lux |
| customer_id |
Customer-id in the format: (FK) cus_1KQHuluxrqX8Lux |
| created_at |
Time and date of subscription-creation: YYYY-MM-DD 00:00:00 |
| current_period_start |
When the current billing cycle started: YYYY-MM-DD 00:00:00 |
| product_name |
Name of subscription - including and not limited to: Translate Yourself / Content Generation / LaaS Enterprise - Annual billing / SCALEUP |
| status |
Status of subscription, categorical: active / canceled / unpaid / paused / past_due / incomplete |
Charges table
The charges table is extracted from Stripe and contains details about each unique charge, with the following columns:
| id |
Unique charge-id (PK), either in the format py_1KQHuluxrqX8Lux or ch_1KQHuluxrqX8Lux |
| customer_id |
Customer-id in the format: (FK) cus_1KQHuluxrqX8Lux |
| amount | The amount of each charge, in EUR |
| created_at |
Time and date of charge: YYYY-MM-DD 00:00:00 |
| description |
Description of charges, such as: Payment for Invoice / Subscription update/ Automatic charge to reconcile unspent funds/ Subscription Creation.. etc. |
Customers table
The customers table is extracted from Stripe and contains details about each unique customer, with the following columns:
| customers | |
| id |
Unique customer-id in the format: (PK) cus_1KQHuluxrqX8Lux |
| software_id |
The software-id for each customer, in the format: aa99abc-99a9-b00c-a9a99aa99 |
| created_at |
Time and date of creation of customer: YYYY-MM-DD 00:00:00 |
| payment_method_attached |
Boolean: TRUE or FALSE |
| domain | Name of customer |
| Email of customer | |
MRR-changes table
The MRR-changes table is extracted from Stripe as an event table, similar to the one that can be extracted as a csv under MRR Breakdown found among the Stripe Dashboards. The columns in the MRR changes table are:
PLG-records table
The PLG records are an extraction from Stripe that contains every customer that has converted from a Freemium subscription to either the Scaleup or the Startup package from February 10th 2023. It contains the following columns:
| plg_records | |
| customer_id |
Customer-id in format: cus_1KQHuluxrqX8Lux |
| plan |
What plan the customer has converted to, either: startup / scaleup |
| plg_date |
Time and date for converting to either scaleup or startup, in format: YYYY-MM-DD 00:00:00 |
| signup_date |
Time and date for creation of freemium subscription, in format: YYYY-MM-DD 00:00:00 |
| software_id |
The software-id for each customer, in the format: aa99abc-99a9-b00c-a9a99aa99 |
Software table
The software table is extracted from the software platform, and contains the following columns:
| software_data | |
| account_id |
Id for each customer, in the format: aa99abc-99a9-b00c-a9a99aa99 |
| created_at |
Time and date for creation of software customer, in format: YYYY-MM-DD 00:00:00 |
| strings_tier |
Strings tier: tier-1 / startup / scaleup / freemium |
| strings_usage |
Strings usage, integer (obs: stored as text) |
| translators_tier |
Translators tier: tier-1 / tier-2 / tier-3 / tier-4 / startup / scaleup / freemium |
| translators_usage |
Strings usage, integer (obs: stored as text) |
| words_tier |
Words tier: tier-1 / tier-2 / tier-3 / tier-4 / tier-5 / tier-6 / startup / scaleup / freemium |
| words_usage |
Strings usage, integer (obs: stored as text) |
| workflows_tier |
Workflows tier: tier-2 / startup / scaleup / freemium |
| workflows_usage |
Strings usage, integer (obs: stored as text) |
Subscriptions churned table
The subscriptions churned table is extracted from Stripe and contains information about each unique subscription that has churned, with the following columns.
| subscriptions_churned | |
| canceled_at |
Time and date of cancelation in format: YYYY-MM-DD 00:00:00 |
| churn_date |
Time and date of actual churn in format: YYYY-MM-DD 00:00:00 |
| customer_id |
Customer-id in the format: (FK) cus_1KQHuluxrqX8Lux |
| id |
Unique subscription-id from Stripe in format: (PK) sub_1KQHuluxrqX8Lux |
Human AI table
The
| human_ai_data | |
| created_at |
Time and date for creation of segment, in format: YYYY-MM-DD 00:00:00 |
| id |
Id for each single segment, in format: 65b7882445de60ccf0fc7c3 |
| next_segment |
Following segment after current |
| previous_segment |
Previous segment before current |
| qa_average |
The average qa-score across the five dimensions. |
| qa_comment |
Comment on the translated target segment |
| qa_score_accuracy |
The qa-score on the accuracy dimension for current segment |
| qa_score_language |
The qa-score on the language dimension for current segment |
| qa_score_locale |
The qa-score on the locale dimension for current segment |
| qa_score_style |
The qa-score on the style dimension for current segment |
| qa_score_terminology |
The qa-score on the terminology dimension for current segment |
| qa_suggested_translation |
The suggested translation for the target segment - where applicable |
| source |
The text that should be translated |
| source_language |
The language of the text that is being translated |
| target |
The translated text |
| target_language |
The language of the translated text |
| team_id |
Id of customer |
| team_name |
Customer name |
| character_count |
The number of characters in each segment (source text) |
| word_count |
The number of words in each segment |
Calculated tables
Date table
The Date table is created in Power BI, and contains every date from January 2020 to today's date. Today's date is a DAX function, and will update and add a new row for every new date we enter. The tables contain the following columns:
| DATETABLE | |
| Date | DD-MM-YYYY 00:00:00 |
| MonthYear | YYYY-MM |
MRR changes modified
In order to break down the extracted MRR table into event types, a calculated table is necessary. This table summarize the original MRR table by the columns customer_id, created_at and added_mrr. It also adds the domain-column from the customers table, as the relation between other tables are lost in a calculated table. Based on the added MRR, the previous and current MRR calculated is calculated cumulative by date and each individual customer. In addition, the churn dates from the subscriptions_churned table are added.
DAX code for the calculated table and the calculated columns are provided below
mrr_changes_modified =

SUMMARIZE(

    'mrr_changes',

    'mrr_changes'[customer_id],

    'customers'[domain],

    'mrr_changes'[created_at],

    mrr_changes[added_mrr],

    "mrr_current",

    CALCULATE(

    SUM('mrr_changes'[added_mrr]),

    FILTER(

        ALL('mrr_changes'),

        'mrr_changes'[customer_id] = EARLIER('mrr_changes'[customer_id]) &&

        'mrr_changes'[created_at] <= EARLIER('mrr_changes'[created_at])

        )

),

    "mrr_previous",

     CALCULATE(

    SUM('mrr_changes'[added_mrr]),

    FILTER(

        ALL('mrr_changes'),

    'mrr_changes'[customer_id] = EARLIER(mrr_changes[customer_id]) &&

    'mrr_changes'[created_at] < EARLIER(mrr_changes[created_at])

    )

),

    "churn_date",

    CALCULATE(

        MAX('subscriptions_churned'[churn_date])

    )

)
| mrr_changes_modified | |
| added_mrr | The changed amount of MRR in EUR for a specific customer, either positive (added) or negative (deducted) |
| created_at |
Time and date of creation of event: YYYY-MM-DD 00:00:00 |
| customer_id |
Customer-id in the format: cus_1KQHuluxrqX8Lux |
| domain | Name of customer |
| mrr_current | The running total of mrr for each customer |
| mrr_previous | The last running total of mrr for each customer before current |
plg_including_freemium
In order to create the visuals based on the plg records, the plg_including_freemium calculated table was created. This includes all freemium creations that has not converted yet and adds it as a new category in the tier-column called "freemium".
plg_including_freemium =

VAR FilteredSoftwareData =

    ADDCOLUMNS(

        FILTER(

            software_data,

            software_data[created_at] >= DATE(2023, 2, 10) &&

            software_data[strings_tier] = "freemium" &&

            software_data[translators_tier] = "freemium" &&

            software_data[words_tier] = "freemium" &&

            software_data[workflows_tier] = "freemium"

        ),

        "Tier", "freemium"

    )

VAR FilteredPLGRecords =

    ADDCOLUMNS(

        FILTER(

            plg_records,

            plg_records[signup_date] >= DATE(2023, 2, 10)

        ),

        "Tier", plg_records[plan]

    )

RETURN

UNION(

    SELECTCOLUMNS(FilteredSoftwareData, "account_id", [account_id], "created_at", [created_at], "Tier", [Tier]),

    SELECTCOLUMNS(FilteredPLGRecords, "customer_id", [customer_id], "signup_date", [signup_date], "Tier", [Tier])

)
|
plg_including_freemium |
|
| created_at |
Time and date of creation of freemium-subscription (plg_records[signup_date] and software_data[created_at] joined, in format: YYYY-MM-DD 00:00:00 |
| account_id |
software_data[account_id] and plg_records[software_id] joined: aa99abc-99a9-b00c-a9a99aa99 |
| Tier |
Subscription-tier: Freemium / Scaleup / Startup |
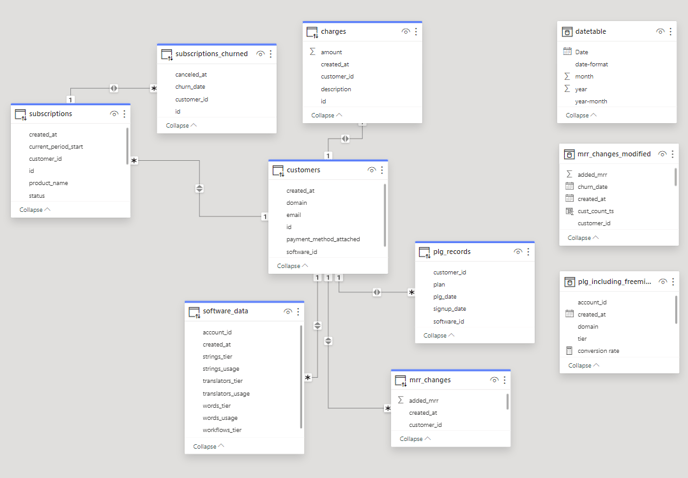
Relational Schema
The described tables above are related as following.
The customers table has four one-to-many relationships from its id-column, where the unique id-column in customers-table is related to one or more multiple rows in charges table (on the customer_id-column), plg_records table (on the customer_id-column), subscriptions table (on customer_id-column) and the mrr_charges table (on the customer_id-column). In addition the customers table is related to the software_data table with a one-to-many relationship from software_id in the customers table to the account_id in the software_data table.
The subscriptions table has a one-to-many relationship with the subscriptions_churned table, both on their id-column. The three calculated tables are naturally not related to any other tables.
The relational schema is visualized by Power BI below.